Disproportionately Aggressive Behavior on Social Media Platform Nextdoor, in Summit and Eastern Portage Counties, Ohio, Grouped by Age and Gender
Table of Contents
1. Introduction
2. Study Methodology and Synopsis
3. Key Findings and Conclusions
1. Introduction
I’ve been on the Nextdoor app for several years. It seemed to me that there was a lot more harassment than I would have expected. Harassment, unfortunately, exists on every social media platform. But the amount on Nextdoor surprised me, not because there was more than other platforms, no, but because Nextdoor is (was) less anonymous than other platforms like Facebook or Twitter.
When I joined Nextdoor, the requirements for a user’s profile were more strict. At the time, you needed an invite from an established user, you were required to use your government first and last name, your profile picture could not be of someone other than you (it could blank or be a picture of the user’s face), and there were strict requirements for technical controls to verify that you are in the location you claim to be.
There was a lot more harassment than I would have expected! In my experience, people, in general, are less likely to bully when they know they can’t hide behind their keyboard. If you called your neighbor a butthead, your neighbor would know exactly who said it! This usually dissuades people from doing things like that, but not always.
Over the years, Nextdoor rolled those above mentioned requirements back. As those requirements all became more and more lax, the harassment increased proportionally.
2. Study Methodology and Synopsis
The goal was to identify demographic characteristics of Nextdoor users participating in online harassment. Because of the sheer volume, I limited this study to only include disproportionately aggressive behavior (example: User B threatens bodily harm because User A dyed their hair).
To make matters more complicated, many of these users did not include a face picture for their profile picture, thus negating facial recognition as an avenue of discovery, and also set their display names to First Name, Last Name Initial (e.g. I would appear as Tony S.)
This left some dots to be connected
Once I found someone exhibiting disproportionately aggressive behavior, I started with their first name and last name initial. The second piece of information is the name of the Nextdoor Neighborhood that the user belongs to. Nextdoor Neighborhoods are divisions within a location, and are at least partially created by Nextdoor users. This has lead to “neighborhoods” that don’t always match up with real world neighborhoods, districts, boroughs, or other administrative divisions. Their borders also appear to me to be mostly arbitrary.
Nevertheless, these Nexdoor Neighborhoods are useful. Nextdoor provides a map that shows each of these. So, when there was a user not showing their full name, I would re-create the neighborhood on Google’s MyMaps. These are maps that are private and, because of my security settings, only viewable by me.
The next step was to get all the addresses of real people with that first name and whose last name starts with that initial. If I were searching myself, I’d need to know all of the “Tony S.”s that live in my city.
To do this, I utilized the State of Ohio’s voter database. State law requires that each county make available to the public data about voters and voting activity for various accountability reasons. The people in the study were primarily located in two counties, so I downloaded those data sets and imported them into a private database server.
A Note on Data Privacy
The network, servers, databases, and end-points all adhere to strict data security regulations and practices as outlined in NIST FIPS and NIST SP 800-53, and are aligned with SOC2 requirements. In addition, the data was deleted at the conclusion of the study, eliminated residual risk to the people in the data set. The MyMaps were also deleted at the end of the study for the same reason.
| My next step was to query the data set for the partial names, and have it output a file of names, addresses, and dates of birth that match. This file was then imported into the private MyMaps map for the study. | |

|
|
As for determining a user’s gender, this was mostly self-reported by the user, either by stating it in other posts or profiles on social media, or including their pronouns in their social media profile bio. When that information was missing, I would use whatever clues I could find and make an educated guess.
Once the study was completed, the database, database outputs, and maps were deleted.
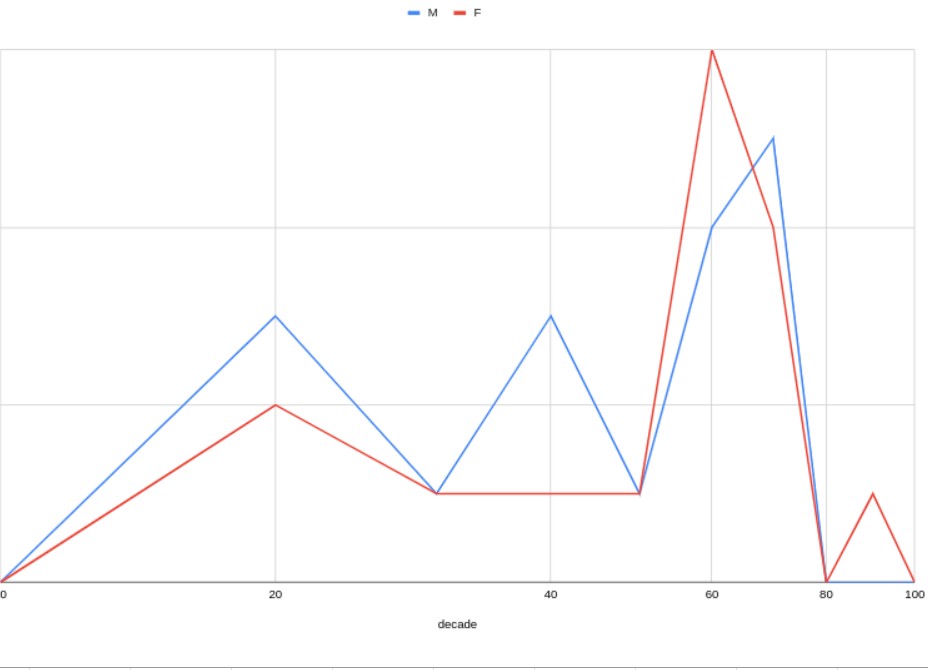
The final step was simple: Each row of a spreadsheet contained the age and gender of each person exhibiting disproportionately aggressive behavior. The precision of the ages was then changed from years to decades. Finally, spreadsheet formulas were used to tabulate the number of mean in each decade and women in each decade.
Then I made a chart!
Data collection was done whenever I saw an example over the course of a few weeks. Gathering the additional information took about an hour. Tabulating the data took about 20 minutes.
3. Key Findings and Conclusion
The most likely person to Disproportionately Aggressive Behavior is a woman in her 60s.
I was planning on gathering other demographic information such as political affiliation and property ownership status, but honestly, I got bored with it and moved on to something else.